Name it and run it
Name it and run it
Step three is the last one: name the report, tell it where to land, and run it.
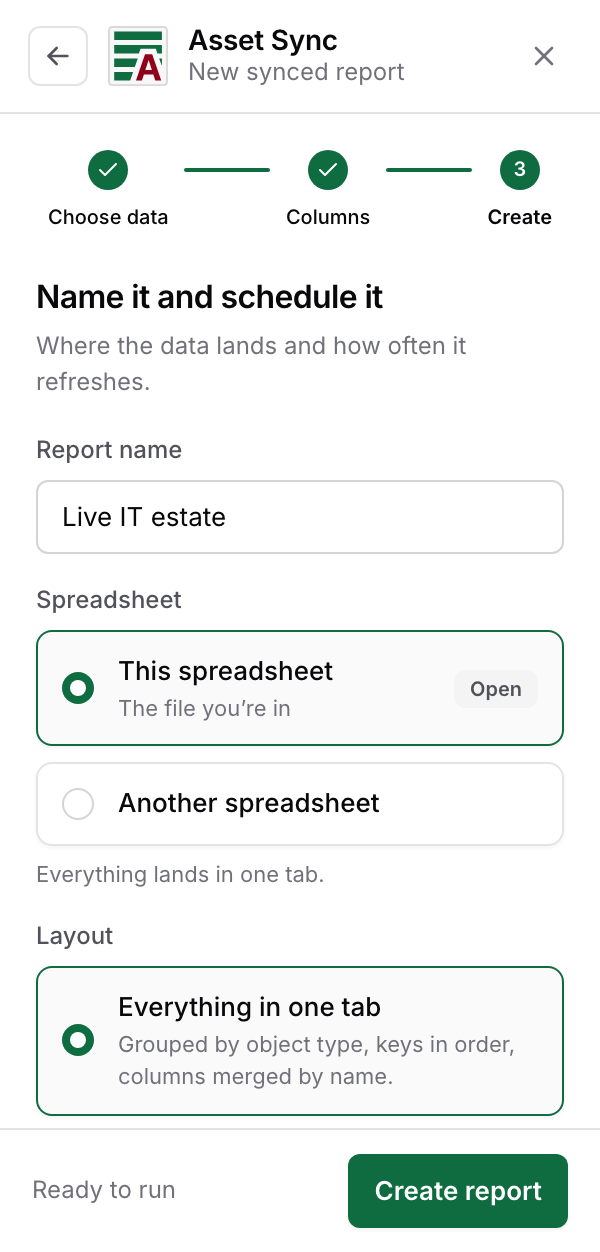
Name the report
Type a name, or leave the field empty and accept the suggestion in the placeholder: a single-type report is named after its type, a multi-type report after its schema. The name is how you will recognise the report in your list later, so a year from now "Laptop audit" beats "Report 3".
Pick the destination
- This spreadsheet: the file you are in right now, shown by name.
- Another spreadsheet: paste the URL of any Google Sheets™ spreadsheet you can edit, and the report writes there instead. Handy when the report belongs in a shared file but you are building it from your own.
Choose the layout
This section only appears when the report has more than one object type.
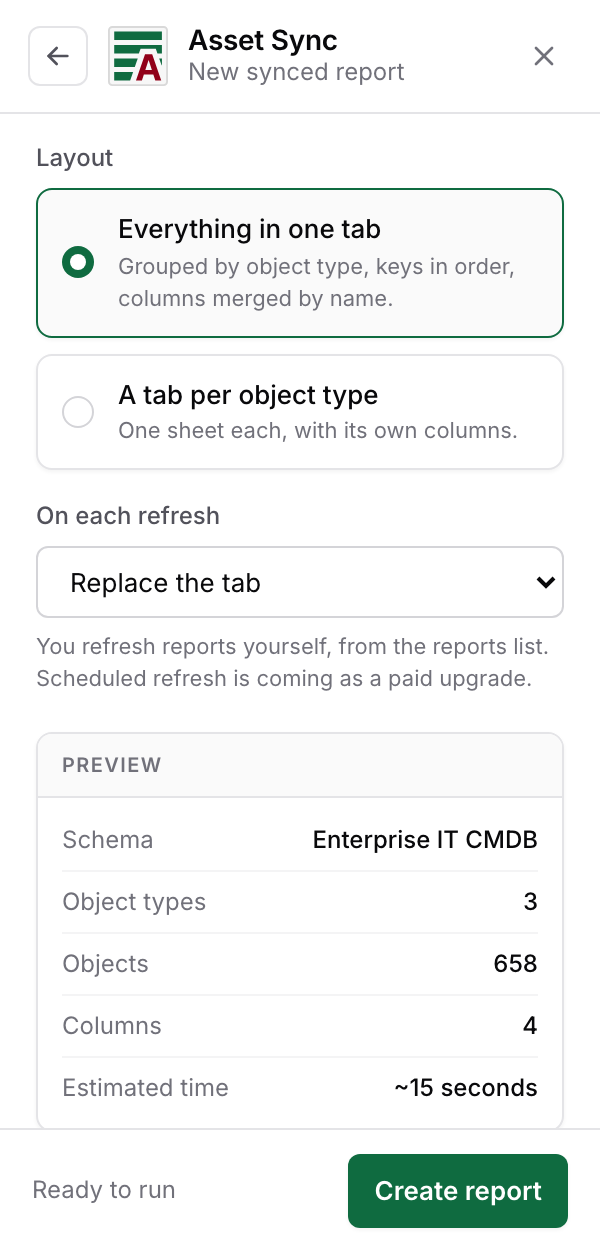
- Everything in one tab (the default): all objects in a single tab, grouped by object type, keys in order, with same-named columns merged.
- A tab per object type: each type gets its own tab, named after the type, with its own columns.
One tab suits reading and sharing; a tab per type suits feeding formulas that expect one kind of thing per sheet.
Decide what a refresh does
On each refresh, choose Replace the tab to rewrite it with the current data, or Add new rows to append underneath what is already there. Replace is the honest default for a report; append is for building a running log. As the note on this screen says, you refresh reports yourself, from the reports list. There is no schedule.
Above the button, a small preview totals what you are about to run: schema, types, objects, columns, and a time estimate.
Run it
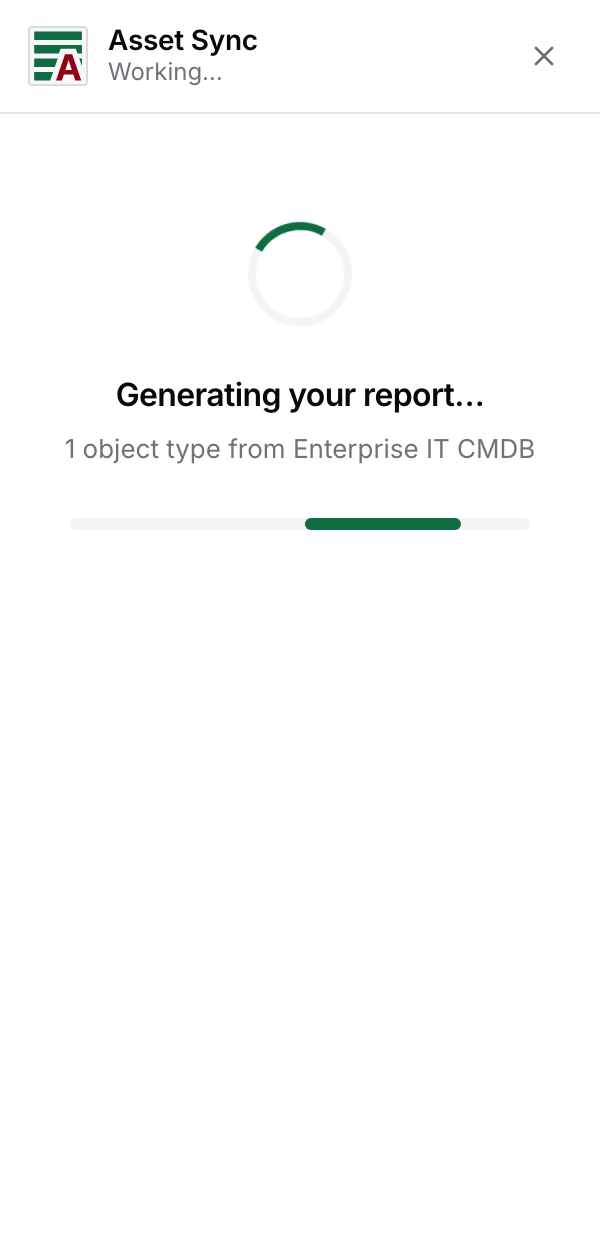
Select Create report. The sidebar shows the run as it happens: connecting to Assets, fetching objects, writing rows.
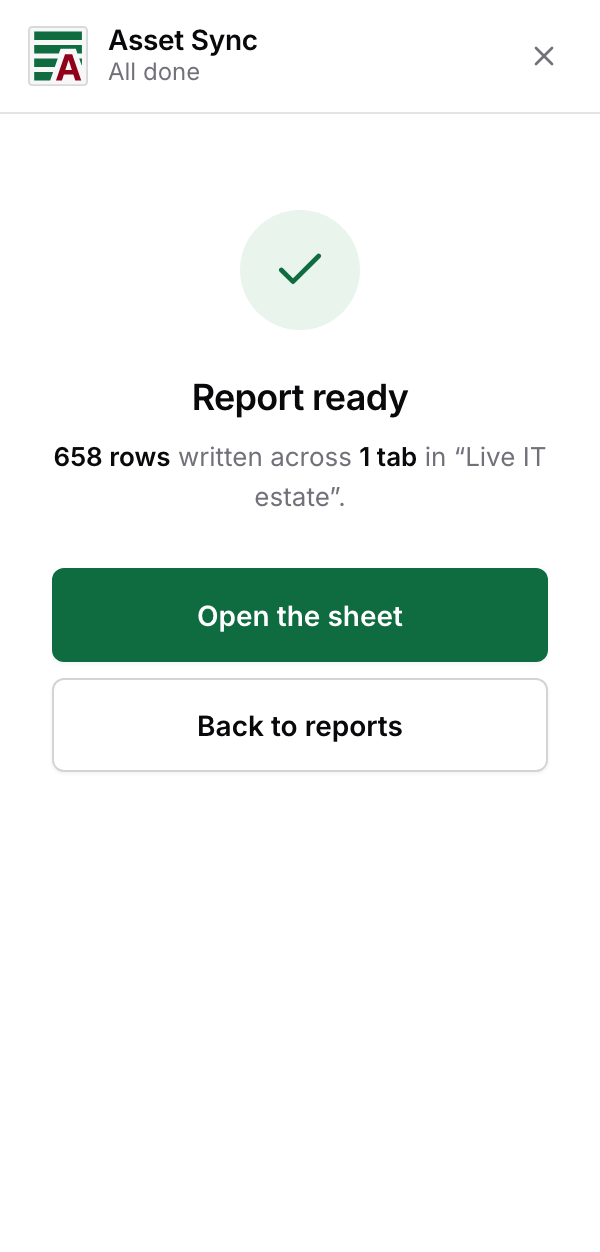
A few seconds later, the result: how many rows, across how many tabs, into which report. Open the sheet takes you straight to the written tab; Back to reports returns you to your list.
If the run fails
A failed run says so, with the actual error, and never pretends to be a success. Back to the wizard returns you to your choices with everything still filled in, so fixing a typo in an AQL query does not mean starting over.
Where to next
Your first report is in the sheet. The last habit to pick up is refreshing it: Refresh and manage your reports.
Google Sheets™ is a trademark of Google LLC.