How it works
How it works
You can trust a report more when you know how it was built. Here is the whole mechanism, with no black box.
Two accounts, one sidebar
The add-on lives in a sidebar docked inside Google Sheets™, opened from the Extensions menu. It needs two connections: Google holds your spreadsheet, Atlassian holds your assets. You connect each one once, through the normal sign-in for that account, and the sidebar shows both as connected from then on. Access to Assets is read-only.
A report is a saved definition
When you finish the wizard, the add-on saves a definition: the schema, the object types, the filter, the columns you picked, the report's name, which spreadsheet it writes to, the tab layout, and whether a refresh replaces the tab or appends to it. The rows in your sheet are the output; the definition is the report. That is why refreshing needs no decisions from you: everything was decided when you built it.
What happens on a run
Every run turns your choices into an AQL query against Assets. If you used the simple filter, the query is built for you from the types and conditions you picked. If you wrote your own AQL, your query is used as written, with one guardrail: the server scopes every query, including yours, to the schema you chose in step one, so type names like "Person" cannot accidentally match objects in a different schema.
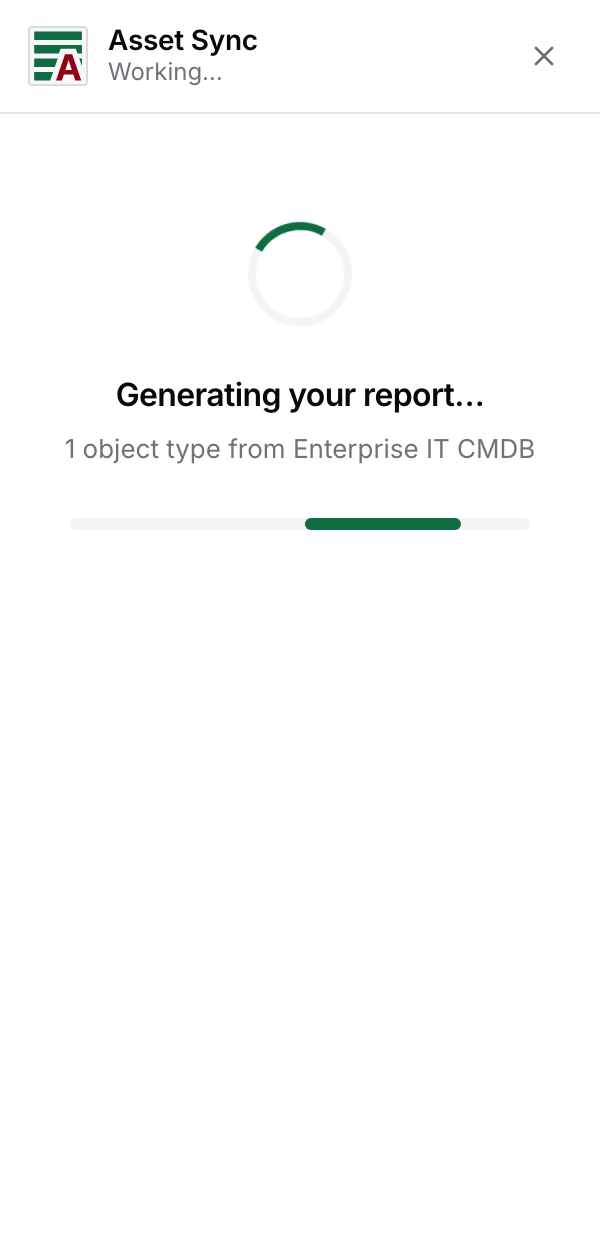
The matching objects are fetched, and the rows are written to your sheet with the object key first in every row, linked to the object in Assets. A single-type report writes one tab. A multi-type report writes either one merged tab, grouped by object type with same-named columns merged, or a tab per object type, each with its own columns, whichever you chose. While it runs, the sidebar shows the stages: connecting, fetching, writing.
Refresh is a rerun
There is no background sync. Refreshing a report from the reports list runs the same definition again and writes the current objects, replacing the tab or adding rows underneath, per the report's setting. The risk with any exported data is that it silently goes stale; the add-on's answer is to make freshness explicit. The data is as current as your last refresh, and you decide when that is.
The two slow columns
Attachments and linked tickets are not part of the objects the query returns. Fetching them takes one extra call to Assets per object, so a report that includes either column runs noticeably slower and is capped at 1,000 objects. Each object stays one row: several linked tickets share one cell, linked to a Jira view of those tickets. Everything else has no cap beyond what a spreadsheet can hold.
Where to next
You now know what the add-on is, where its edges are, and what a run actually does. Head to Get started to install it.
Google Sheets™ is a trademark of Google LLC.